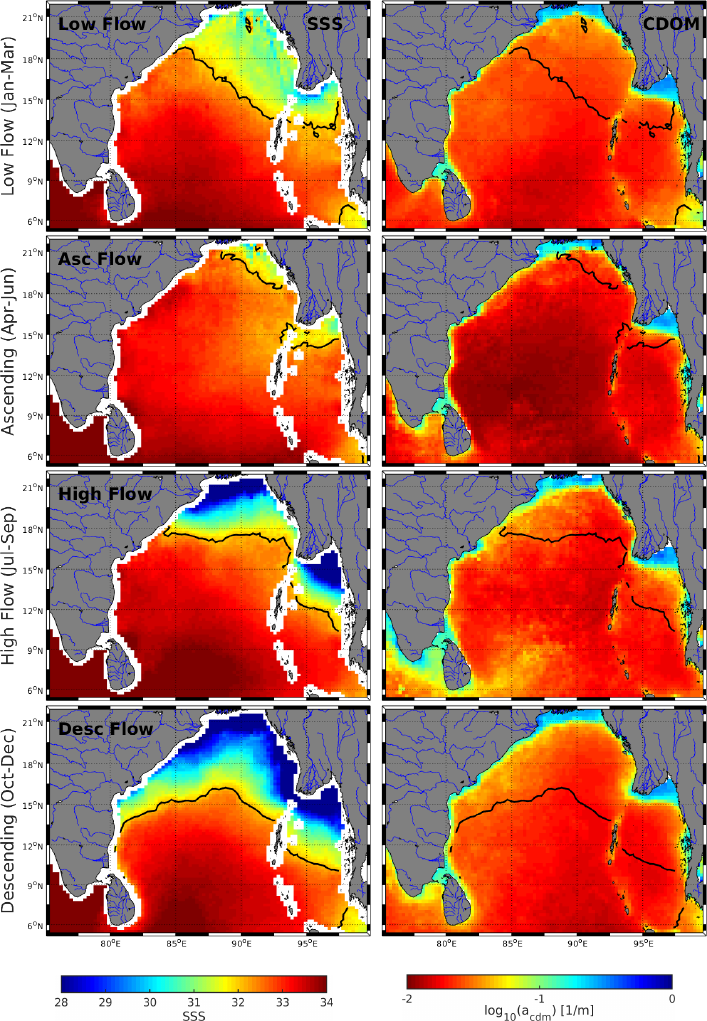
SSS and Ocean Color in the Bay of Bengal
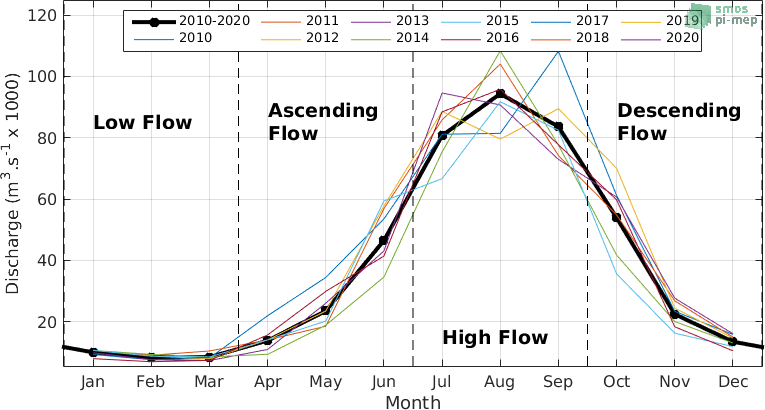
Based upon the Ganges/Brahmaputra River discharge cycle, four main periods can be distinguished as shown in the above figure. From January to March: the low flow ; from April to June: the ascending flow, the high flow from July to September and the descending flow period from October to December.
Here Below we show the spatial patterns of satellite SSS and the absorption coefficient of CDOM at 443 nm derived from monthly Globcolour product. By default, the CCI-L4-ESA-MERGED-OI-V1.8-30DAY-RUNNING satellite SSS product averaged over all years are shown. The user can access to different pairs of satellite SSS and CDOM maps and different averaging period using the following menu: