Overview
Context
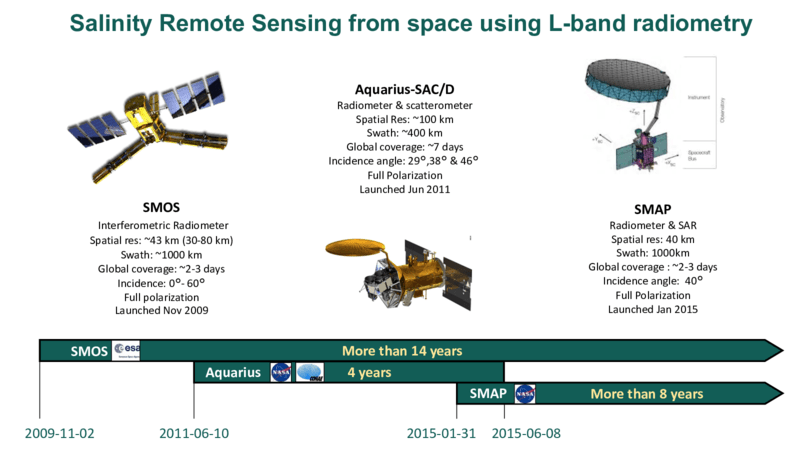
The ESA Soil Moisture and Ocean Salinity (SMOS) and two other recent NASA satellite missions: the Aquarius-SAC/D and the Soil Moisture Active Passive (SMAP) are the first three missions to provide regular Sea Surface Salinity (SSS) measurement capabilities at global scale from space. They are all new instruments and mission concepts. The relatively young era of satellite SSS is made of new technology and scientific developments, unknowns associated to new data discoveries, and particularly from the perspectives of the retrieval algorithms, calibration/validation of the retrieved SSS data but also in terms of the science applications that they do enable.
A large number of satellite SSS datasets and validation approaches have been produced by the different ground segments, scientists and associated expertise groups of the missions (ESA/DPGS & ESLs, CNES/CATDS/DPGS & CECs, ICM-CSIC/BEC, NASA/JPL, NASA/GSFC, ESR, IPRC, REMSS, Ocean Salinity Science Team, Satellite & In Situ Salinity (SISS) Working Group, ...) as well as researchers using those products. This diversity is explained by the exploratory nature of the Satellite SSS missions, their new instrumental concepts and the discovery of the first spaceborne SSS measurements. Therefore, since 2010, there have been continuous research efforts carried with associated developments and the diversity of approaches developed is in response to the diversity of scientific challenges faced at different levels by different data centers team (e.g. for SMOS, raw and swath data processing at ESA/DPGS, the generation of composite SSS products at CATDS, BEC, ...). The Pi-MEP downloads, regularly updates, archives and processes an ensemble of required input datasets that are used by the platform to perform satellite SSS remote sensing analyses. There are several types of data:
- Satellite SSS Core datasets (L2/L3/L4)
- In situ Core datasets
- Auxiliary geophysical datasets
- Numerical Weather Prediction (NWP) and Numerical Ocean Prediction (NOP) datasets
- Process study dedicated datasets
These datasets are described in detail in the input data page.
The Pi-MEP is designed to allow systematic comparisons between available datasets by providing comparable QC metrics for all these SMOS data derived SSS products, as well as for the two other NASA missions. This enables:
- the user to choose which satellite SSS product is best adapted for their own specific application,
- to improve the Level 2 to Level 4 SSS retrieval algorithms by better systematically identifying the conditions for which a given SMOS, or other satellite, SSS products are of good or degraded quality.
- to in fine converge towards best approaches and generate less but better satellite SSS products.
A large ensemble of in situ SSS data distributed by different data centers is used to infer SMOS, Aquarius or SMAP SSS data product quality. These include in situ data from the following sources:
- ARGO float data (Coriolis GDAC)
- Moored buoy data (TAO, PIRATA, RAMA, STRATUS, NTAS, SPURS1-2, WHOTS)
- Thermo-Salinograph data installed on Voluntary Observing Ships (LEGOS, SAMOS)
- Thermo-Salinograph data installed on Research Vessels (GOSUD, Polarstern, NCEI-0170743, CSIC-UTM)
- Thermo-Salinograph data installed on Sailing Ships (GOSUD)
- Surface Drifters (LOCEAN)
- Equipped marine mammals (MEOP)
- Saildrones (Saildrone, NOAA/PMEL)
- Analyzed in situ data fields (IFREMER/LOPS)
- Dedicated Campaign data (e.g. SPURS, EUREC4A)
- Validated database (e.g. ICES)
In Situ Database Reports
These in situ SSS data have different Quality Control (QC), horizontal, vertical & temporal sampling characteristics and they often need to be pre-processed to be properly compared to large-footprint size satellite SSS products. The Pi-MEP centralizes, regularly update, QC-control and filter these input in situ datasets. The status of the in situ datasets used by the Pi-MEP is summarized in a regularly updated report accessible here.
Satellite/In Situ Match-Up files
The platform then systematically co-localizes all Level 2 to Level 4 satellite SSS products from all sensors and associated data centers with the various pre-processed (QC-controlled) in situ datasets. For a given satellite/in situ SSS product pair, the results of the co-location are stored in the so-called Match-up DataBase (MDB) files provided in NetCDF format to the users. MDB data consist of satellite and in-situ SSS pair datasets but also of auxiliary geophysical parameters such as local and history of wind speed and rain rates, as well as various information (climatology, distance to coast, mixed layer depth, barrier layer thickness, etc) that can be derived from in situ data and which are included in the final match-up files. MDB files are generated for each available satellite SSS product files and all available in situ data for the duration of each satellite product. The granularity of the MDB files follows the one of the input satellite data product files. MDB files can be accessed here using either an HTTP or FTP client.
Match-Up Analysis Reports
Results of systematic analyses of the Match-up DataBase (MDB) files generated by the Pi-MEP platform are provided to the users in the form of specific PDF reports. MDB files are analyzed for all pairs of Satellite/In situ SSS data and for an ensemble of 30 geographical Pi-MEP regions. Each report presents successively:
-
The MDB file DataSets
- A short description of the satellite SSS product considered in the match-up
- A short description of the In situ SSS dataset considered in the match-up
- A short description of the auxiliary geophysical datasets co-localized with SSS pairs
- An overview of how the Match-ups were evaluated
- An overview of the MDB characteristics for the particular in situ/satellite pairs
-
The major results of the MDB file Analyses:
- Spatial Maps of the Time-mean and temporal STD of in situ and satellite SSS and of the ∆SSS where ∆SSS = SSSSAT - SSSInsitu denotes the difference between the satellite and in situ SSS at the colocalized points that form the MDB,
- Time series of the monthly averaged mean and STD of in situ and satellite SSS and of the ∆SSS,
- Zonally-averaged Time-mean and temporal STD of in situ and satellite SSS and of the ∆SSS,
- Scatterplots of satellite vs in situ SSS by latitudinal bands,
- Time series of the monthly averaged mean and STD of the ∆SSS sorted by latitudinal bands,
- ∆SSS sorted as function of geophysical conditions,
- A summary with tables of statistics and validation metrics.
All analyses are conducted over the user-chosen Pi-MEP region and over the full satellite SSS product period. The Match-Up analyses reports can be accessed here.
Case studies
The Pi-MEP project also intends to promote the satellite SSS missions by monitoring a series of process studies in various oceanographic domains where satellite SSS products are exploited. To this end the Pi-MEP website contains a dedicated webpage for each case study, where users can find explanations, up-to-date plots and reports. Today, the platform systematically analyzes several major case studies:
- Large River Plumes
- Mesoscale signatures in a Western boundary current
- High latitudes and semi-closed seas
On these pages, the user will find a web-page with a menu on the right giving access to:
- A literature review with links to published papers for the given case study,
- The SSS in-situ/satellite Match-up files and reports generated over the chosen case study region. The best ranked (with respect to ARGO, TSG and drifters data) SMOS, Aquarius and SMAP L3 products will be selected for further case study illustration. Indicators on the SSS spatio-temporal variability in the region shall be provided in the reports.
- In addition, the web page gives access to dedicated analysis results for each particular case study available in sub-menus.
Pi-MEP Data Vizualisation and extraction tools
1. Syntool
Syntool is a web application to explore and visualize collections of satellite, in-situ and model data. By rendering various sources of data on the same map it aims to reveal synergies between multiple sensors and simulations. The main component of the Syntool application is a cartographic view which takes most of the available screen space. This view is built upon the widely used OpenLayers library which has been tested on most platforms and web browsers. This library can load data using most GIS protocols (TMS, WMS, etc...), render them on a 2D map and let users move the map around by dragging it with the mouse or zoom to a specific area by using the mouse wheel. Pi-MEP core datasets (satellite, model and in situ) are made available on syntool as well as ocean surface currents, sea surface temperature, wind speed and precipitation products that are listed here.
To learn how to use this application, you can check out this quick start guide.
2. Plot Interface
By offering sensible default settings, text hints tailored for salinity products and limiting options to the ones needed for the project, the plot interface allows quick visualization of all Pi-MEP datasets. Based on big data technology for efficient storage and manipulation of georeferenced data, this interface computes statistics and generate plots on the fly.
It contains the controls for selecting an area and a time range, for adding a new plot and for the configuration of each type of plot: (multi-) time series, scatter plots, and map charts.
All plots can be exported as PNG images to be easily embedded in documents. Time series, scatter plots and histograms provide some additional interactivity to focus on a subdomain (zoom/pan) or a specific data point (value under cursor). A menu will also offer the possibility to download the data as CSV files for these three plots.
To learn how to use this application, you can check out this quick start guide.
3. Match-up interface
Searching match-ups and extracting the associated data is made easy using this tool. The match-up interface which contains a form to define the search filters (spatial, temporal, satellite product, in situ dataset, distance to coast, ...), provides means to visualize the results as plots and lets the user download them as CSV files.
To learn how to use this application, you can check out this quick start guide.
4. Merginator
In many situation, scientists want to compare data collocated on specific regions and time periods (visually at least). Merginator is a web application using the full catalog of Pi-MEP datasets, to build thematic web interfaces mixing different sources of products (satellite L2 to L4, in-situ, model), performing collocation and generating images on the fly.
To learn how to use this application, you can check out this quick start guide.
5. Jupyter notebooks
Jupyter is a web interface where users can write documents that contain code, text, mathematics, plots and rich media. By default, code is executed remotely on the webserver but the notebook server can be configured to delegate code execution to machines which have both access to the data and to the webserver, which is a better option for scalable infrastructures. By default, only Python code is supported but Jupyter has a modular design and other languages can be added by installing plugins.
The notebooks server offered by the Pi-MEP gives users the possibility to develop and execute their own algorithms within a Python environment with pre-installed modules for scientific processing and with access to a large amount of data. Due to the remote execution mechanism, code written by users has a direct access to the Pi-MEP files and can produce results without requiring the transfer of a potentially high volume of input data.
For accountability (computing resources are limited) and security reasons only authenticated users will be allowed to execute notebooks on the platform.