Sampling surface salinity in a high-precipitation region of the eastern tropical Pacific
Literature Review
Overview
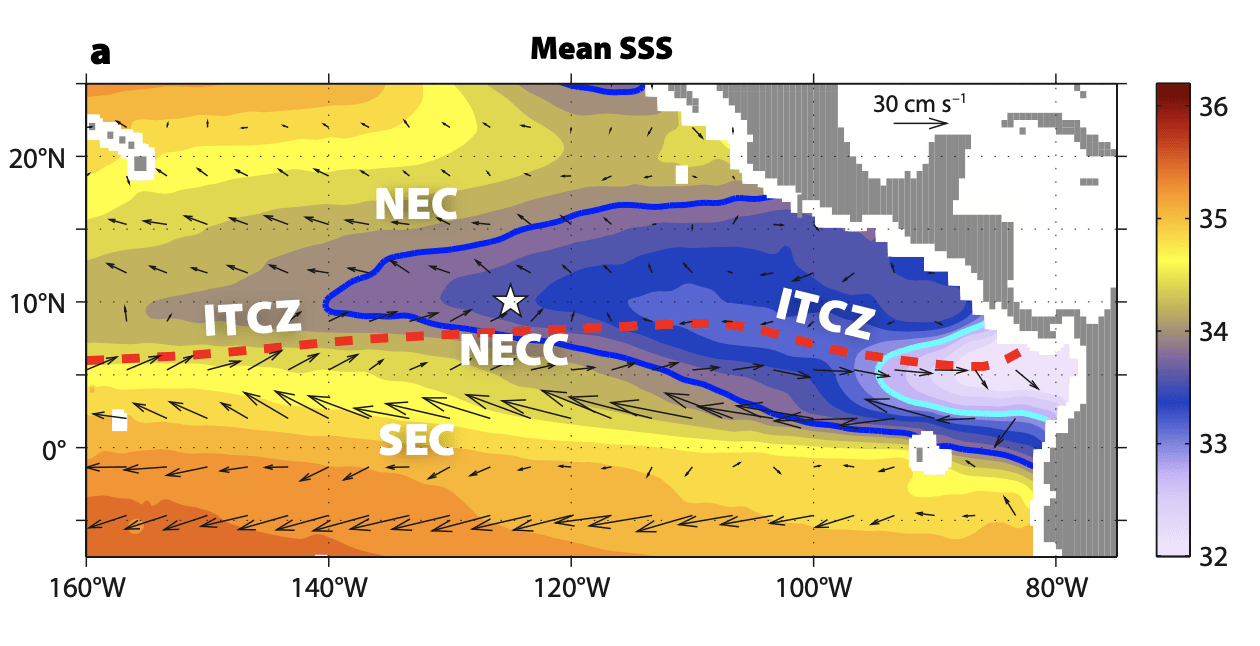
Fig. 1. From Melnichenko et al. (2019). Mean surface salinity in the eastern tropical Pacific. The blue contour indicates 34 psu, considered to be the western edge of the EPFP. The red dashed line is the mean axis of the ITCZ. The mean surface currents are shown by arrows with a scale at the top right. The main current systems that impact this area are the North Equatorial Current (NEC), the North Equatorial Countercurrent (NECC) and the South Equatorial Current (SEC) all indicated by lettering. The white star is the location of the SPURS-2 field campaign in the middle of the EPFP and at the northernmost seasonal extent of the ITCZ.
The 2016-2017 Salinity Processes in the Upper-ocean Regional Studies (SPURS-2) field experiment sampled the westward extension of the eastern tropical Pacific fresh pool (EPFP; Alory et al., 2012). This is a low surface salinity feature which extends westward from the coast of Panama and Colombia. It contains some of the freshest surface water in the global ocean due to runoff from rivers in Central America and atmospheric transport of freshwater from the Atlantic across the Central American isthmus (Fig. 1). The EPFP is also associated with the intertropical convergence zone (ITCZ). This is a band of converging air, thick clouds and heavy rain (Fig. 2) which makes seasonal excursions between the equator and about 10°N.
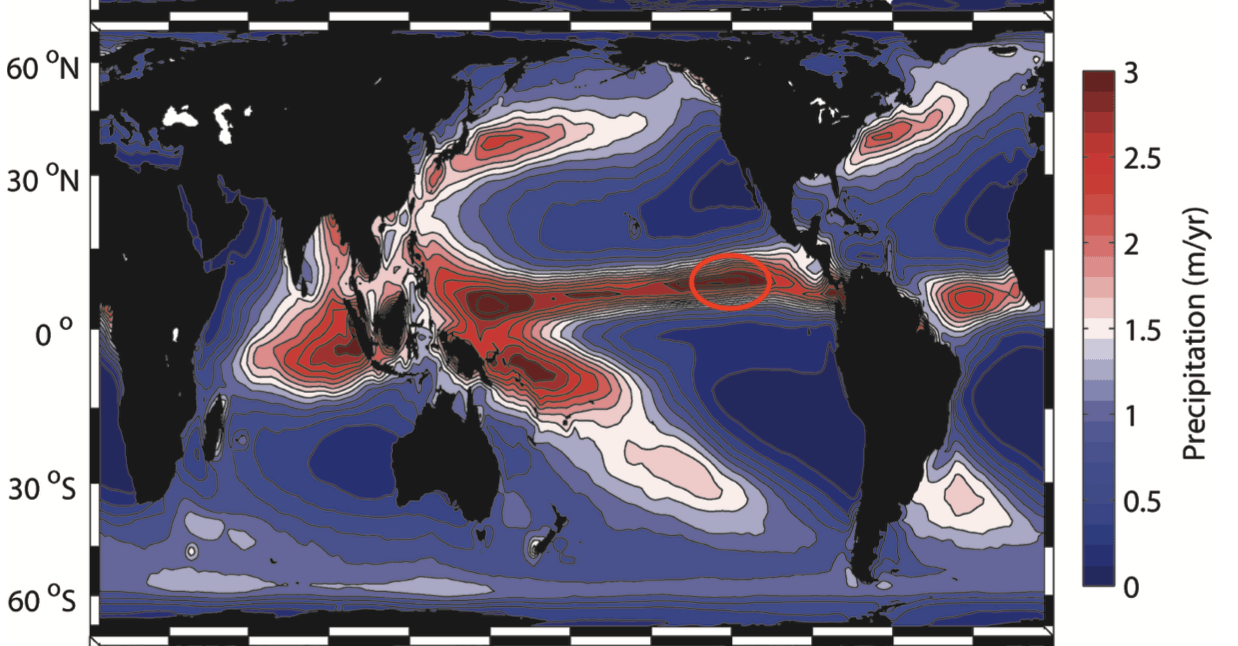
Fig. 2. From Schanze et al., 2010. Annual mean precipitation over the globe. The red circle in the eastern tropical Pacific is the location of the SPURS-2 field campaign in 2016-2017.
The EPFP extends westward seasonally from the eastern boundary of the tropical Pacific reaching its maximum extent in the October/November period (Guimbard et al., 2017; Fiedler and Talley, 2006; Melnichenko et al., 2019). At the southern edge of this fresh pool extension is a surface front separating the relatively fresh EPFP water from higher salinity surface water found at the equator (Yu, 2015). This front is the location of the North Equatorial Countercurrent (NECC; Kessler, 2006), which forms in January near 3°N, migrates to the north over the course of the year, and dissipates in the months of January-February after reaching a maximum latitude of about 12°N (Yu, 2015).
As is clear from Figs. 1 and 2, the region where SPURS-2 took place is a highly dynamic one. Two powerful currents, the westward NEC and eastward NECC exist in this area, contributing to the back and forth motion of the EPFP. These currents are generated by wind patterns in the ITCZ region, including a surface convergence. Rising air associated with this convergence, leads to the rainfall we see in Fig. 2. The SPURS-2 site is one of the rainiest places on Earth on average.
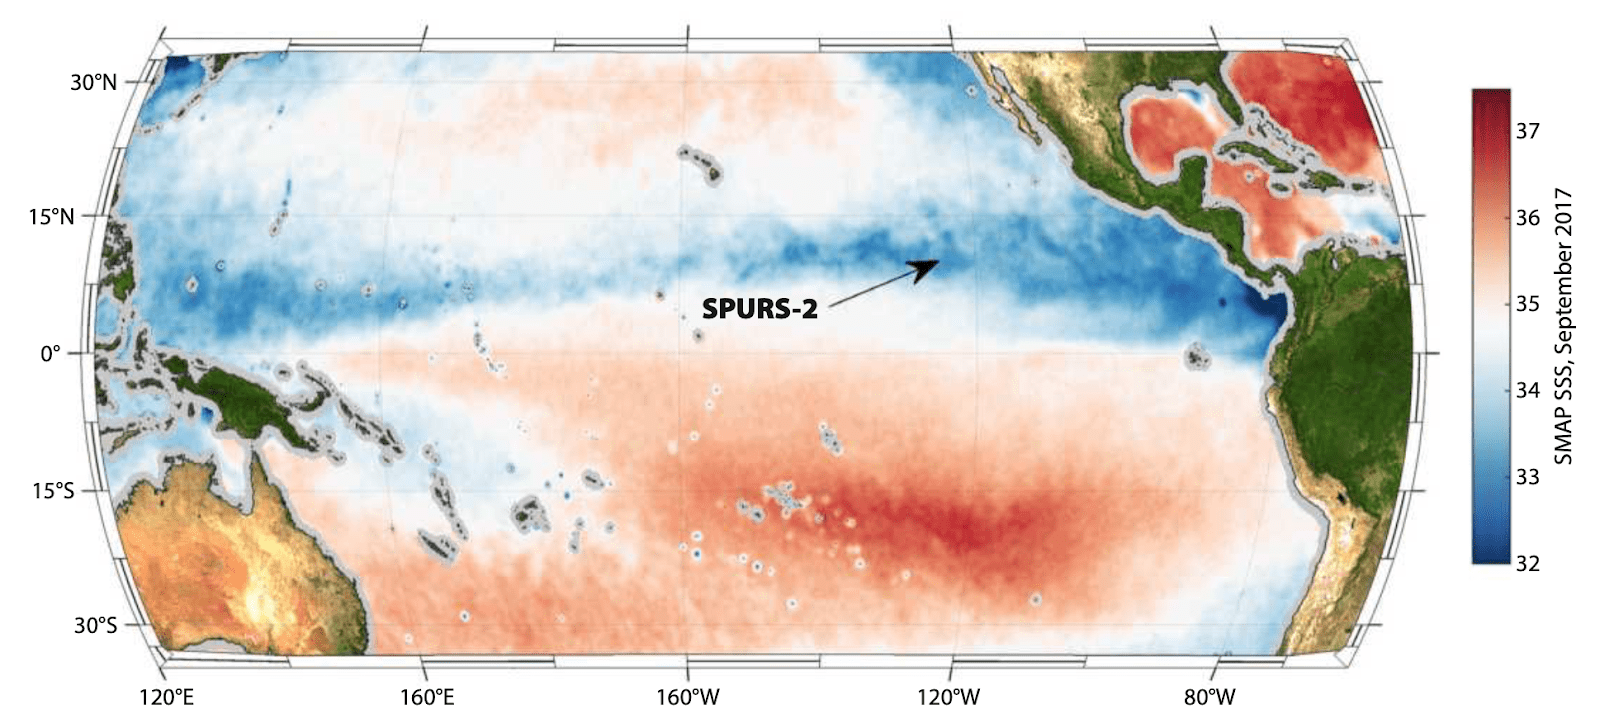
The purpose of SPURS-2 was to elucidate the relationship between rainfall, ocean dynamics and surface salinity. Rainfall in the region is heavy on average, but also very patchy (Thompson et al., 2019; Rutledge et al., 2019a,b) and seasonal. When it does rain, the freshwater input into the ocean is buoyant and tends to sit at the surface in very thin (<5m) fresh puddles (Drushka et al., 2019; Clayson et al., 2019) for some period of time before it mixes into the ocean below. How do these small-scale puddles combine with the larger-scale current systems to generate the low salinity feature at the surface that stretches across the entire tropical Pacific that we see in maps like that of Fig. 3? How large is the near-surface salinity stratification induced by rainfall? How does this stratification depend on rain rate and wind speed (that causes vertical mixing)? Moreover, the patchiness of rainfall and the small-scale ocean dynamics also result in small-scale variation of SSS within satellite footprints, namely, sub-footprint variability (SFV). SFV can lead to differences between the “match-up” of satellite SSS (averaged over satellite footprints) and pointwise in-situ measurements because of the differences in spatial scales captured by satellites and in-situ platforms as well as their temporal sampling mis-match.
Fig. 3. From Lindstrom et al. (2019). Sea surface salinity for the month of September 2017 from satellite data. Color scale is at right. The SPURS-2 site is indicated by an arrow.
Some publications studying SSS processes in the SPURS2 region
Alory, G., C. Maes, T. Delcroix, N. Reul, and S. Illig(2012)Seasonal dynamics of sea surface salinity off Panama: The far Eastern Pacific Fresh Pool.Journal of Geophysical Research 117, C04028.https://doi.org/10.1029/2011JC007802
Clayson, C.A., J.B. Edson, A. Paget, R. Graham, and B. Greenwood(2019)Effects of rainfall on the atmosphere and the ocean during SPURS-2Oceanography 32(2):86–97.https://doi.org/10.5670/oceanog.2019.216
Drushka, K., W.E. Asher, A.T. Jessup, E.J. Thompson, S. Iyer, and D. Clark(2019)Capturing fresh layers with the surface salinity profiler.Oceanography 32(2):76–85.https://doi.org/10.5670/oceanog.2019.215
Guimbard, S., N. Reul, B. Chapron, M. Umbert, and C. Maes(2017)Seasonal and interannual variability of the Eastern Tropical Pacific Fresh Pool.Journal of Geophysical Research 122:1,749–1,771.https://doi.org/10.1002/2016JC012130
Hasson, A., J.T. Farrar, J. Boutin, F. Bingham, and T Lee(2019)Intraseasonal variability of surface salinity in the eastern tropical Pacific associated with mesoscale eddies.J. Geophys. Res.http://dx.doi.org/10.1029/2018JC014175
Lindstrom, E.J., J.B. Edson, J.J. Schanze, and A.Y. Shcherbina(2019)SPURS-2: Salinity Processes in the Upper-ocean Regional Study 2. The eastern equatorial Pacific experiment.Oceanography 32(2):15–19.https://doi.org/10.5670/oceanog.2019.207
Melnichenko, O., P. Hacker, F.M. Bingham, and T. Lee(2019)Patterns of SSS variability in the eastern tropical Pacific: Intraseasonal to interannual timescales from seven years of NASA satellite data.Oceanography 32(2):20–29.https://doi.org/10.5670/oceanog.2019.208
Rutledge, S.A., V. Chandrasekar, B. Fuchs, J. George, F. Junyent, P. Kennedy, and B. Dolan(2019a)Deployment of the SEA-POL C-band polarimetric radar to SPURS-2.Oceanography 32(2):50–57.https://doi.org/10.5670/oceanog.2019.212
Rutledge, S.A., V. Chandrasekar, B. Fuchs, J. George, F. Junyent, B. Dolan, P.C. Kennedy, and K. Drushka(2019b)SEA-POL Goes to Sea.Bull. Amer. Meteor. Soc., 100, 2285–2301.https://doi.org/10.1175/BAMS-D-18-0233.1
Thompson, E.J., W.E. Asher, A.T. Jessup, and K. Drushka(2019)High-resolution rain maps from an X-band marine radar and their use in understanding ocean freshening.Oceanography 32(2):58–65.https://doi.org/10.5670/oceanog.2019.213
Willett, C.S., Leben, R., Lavín, M.F.(2006)Eddies and mesoscale processes in the eastern tropical Pacific: a review.Progress in Oceanography 69 (2–4), 218–238.http://dx.doi.org/10.1016/j.pocean.2006.03.010
Wyrtki, K.(1964a)Upwelling in the Costa Rica Dome.Fishery Bulletin 63, 355–372.
Wyrtki, K.(1964b)The thermal structure of the eastern Pacific Ocean.Deutschen Hydrographischen Zeitschrift, Erga ̈nzungsheft A 6, 84.
Wyrtki, K.(1966)Oceanography of the eastern equatorial Pacific Ocean.Oceanography and Marine Biology Annual Review 4, 33–68.
Wyrtki, K.(1967)Circulation and water masses in the eastern equatorial Pacific Ocean.International Journal of Oceanology and Limnology 1, 117–147.
Yu, L.(2015)Sea-surface salinity fronts and associated salinity-minimum zones in the tropical ocean.J. Geophys. Res. Oceans, 120, 4205–4225.http://dx.doi.org/10.1002/2015JC010790
Yu, L.(2014)Coherent evidence from Aquarius and Argo for the existence of a shallow low-salinity convergent zone beneath the Pacific ITCZ.Journal of Geophysical Research 119:7,625–7,644.https://doi.org/10.1002/2014JC010030