Front monitoring
The monitoring of the SSS and SST fronts in the Gulf stream region from satelllite data is compared to the front as provided by the numerical model forecasts from Mercator (CMEMS) model. The default satellite SSS product is CCI-L4-ESA-MERGED-OI-V1.8-30DAY-RUNNING and AVHRR data for the satellite SST. You can browse the images for the different years and month in the menu below.
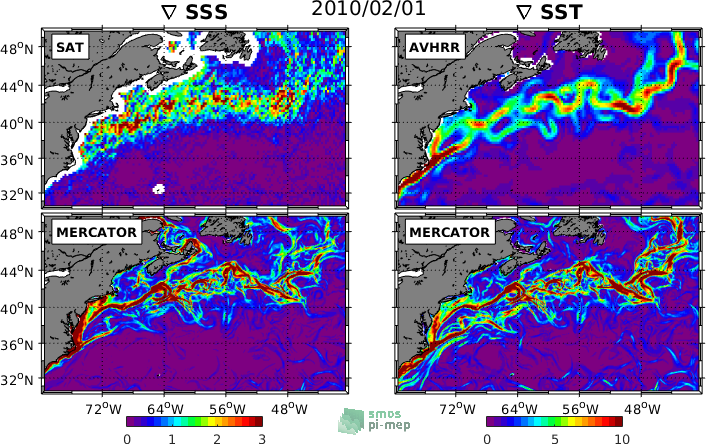
Satellite (CCI-L4-ESA-MERGED-OI-V1.8-30DAY-RUNNING) and model (Mercator) SSS gradients (left) and, Satellite (AVHRR) and model (Mercator) SST gradients. Select the desired year/month to visualize.