Pi-MEP Logo

Salinity Pilot-Mission Exploitation Platform

Hovmöller sections

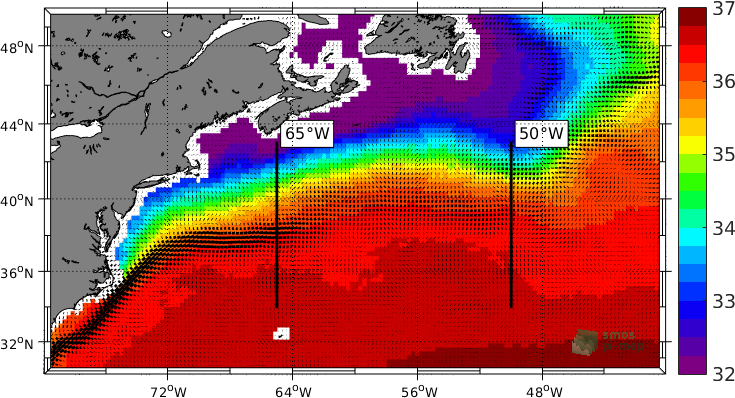
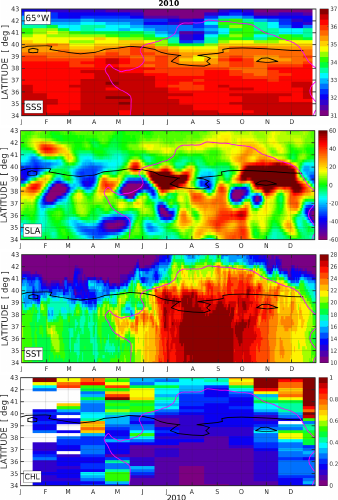
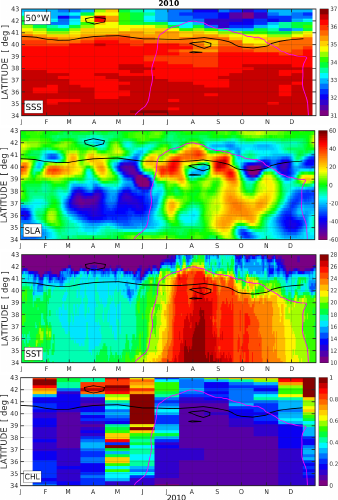
We present herebelow time‐latitude Hovmöller diagrams of Satellite SSS (CCI-L4-ESA-MERGED-OI-V1.8-30DAY-RUNNING), AVISO SLA, AVHRR SST, and Chlorophyll-A (from Globcolour) along 2 zonal transects at longitude 65°W and 50°W which are at two key position of the Gulf-stream weastward flow. The user can visualize the results for the different years using the menu below:

Fig 1: SSS maps showing the two sections at 65°W and 50°W
Time-latitude Hovmöller diagrams at 65°W (left) and 50°W (right) of Satellite SSS (CCI-L4-ESA-MERGED-OI-V1.8-30DAY-RUNNING), AVISO SLA, AVHRR SST, and Chlorophyll-A Globcolour for year 2010. The black and magenta curves are the surface isohaline at 35.4 and the 20°C isotherm, respectively.