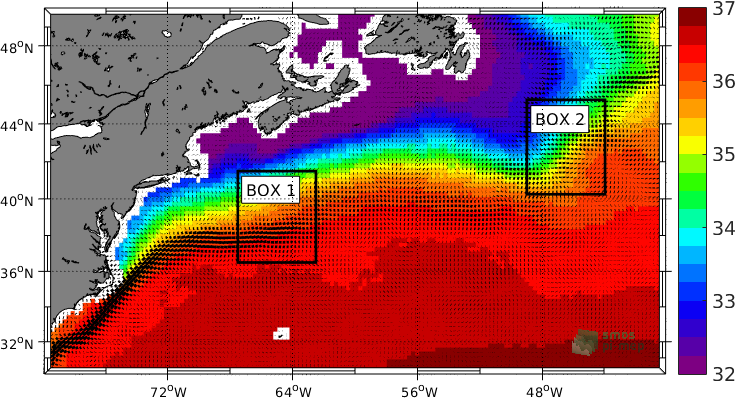
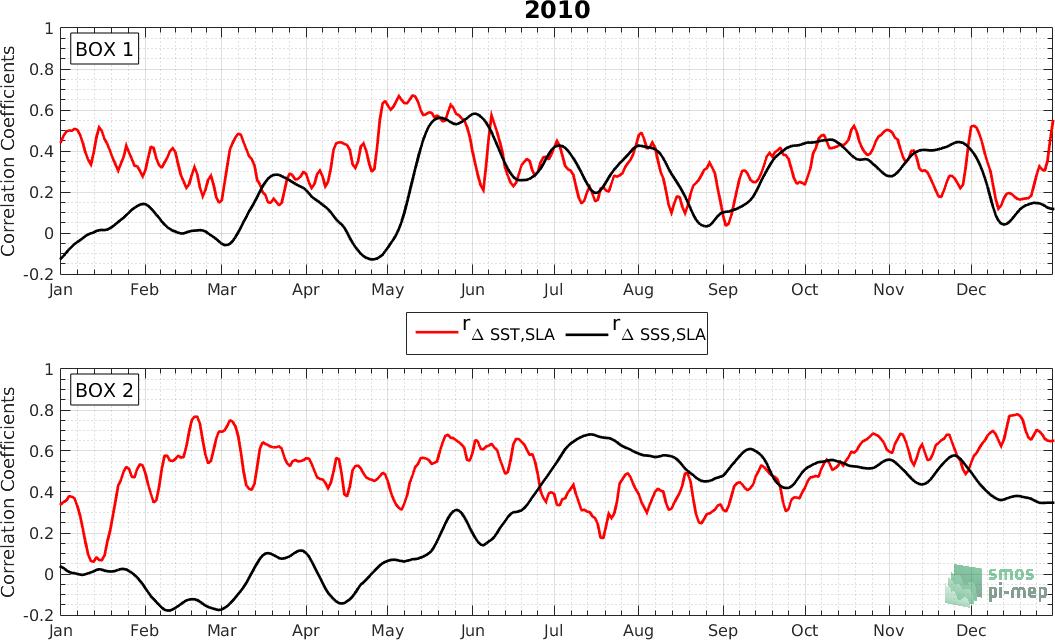
Times series of the 2D correlation coefficients between the Satellite SSS and Aviso Sea level anomaly (SLA) and between SST (AVHRR) and SLA are calculated within 2 key areas defined by the two following 5°x5° boxes: [62.5°W–67.5°W; 36.5°N–41.5°N] and [44°W–49°W; 40.25°N–45.25°N].
Fig 1: SSS maps showing the two box domains defined as [62.5°W–67.5°W; 36.5°N–41.5°N] and [44°W–49°W; 40.25°N–45.25°N]Fig 2: Time series of the 2-D correlation coefficients for year 2010 between the Satellite SSS (CCI-L4-ESA-MERGED-OI-V1.8-30DAY-RUNNING) and SLA (black curve) and between SST and SLA (red curve) within box 1 (top) and box 2 (bottom) shown in the Fig 1. SSS, SLA, and SST were first low-pass filtered to remove large spatial scales >300 km before evaluating the correlation coefficients.