SSS and Ocean Color in the Amazon/Orinoco river plumes

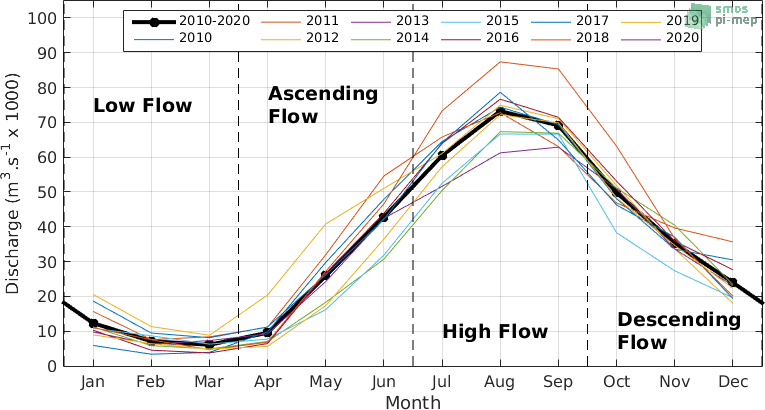
The amplitude of the annual cycle of the Amazon River discharge peaks in June–July. In comparison, the discharge from Orinoco is much lower and peaks in September. Based upon the Amazon River discharge cycle, four main periods can be distinguished as shown in the above figure. From November to January: the low flow ; from February to April: the ascending flow, the high flow from May to July and the descending flow period from August to October.
Here Below we show the spatial patterns of satellite SSS and the absorption coefficient of CDOM at 443 nm derived from monthly Globcolour product. For this example, we only show the results for the SMOS_CATDS_IFR_CEC_L4 satellite SSS product. The results are first provided averaged over all years and then year per year. The user will get access to all pairs of satellite SSS and CDOM maps available in the platform in the operational version
