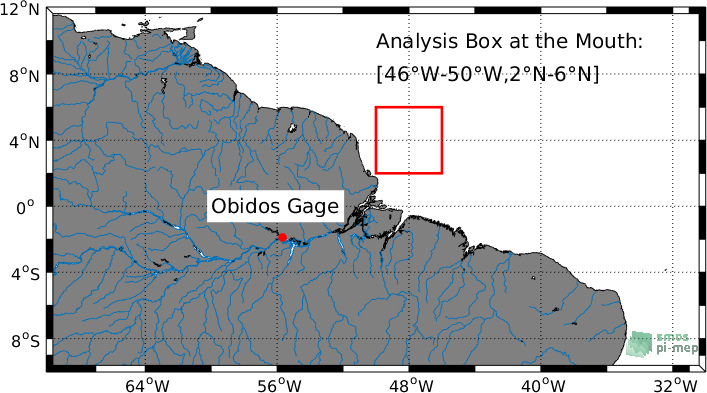
Amazon & Orinoco river plumes
Users can generate their own SSS time series (satellite/In situ) on a given spatial domain around the Amazon and Orinoco river mouths, or at a virtual buoy (point) in that region using the plot interface
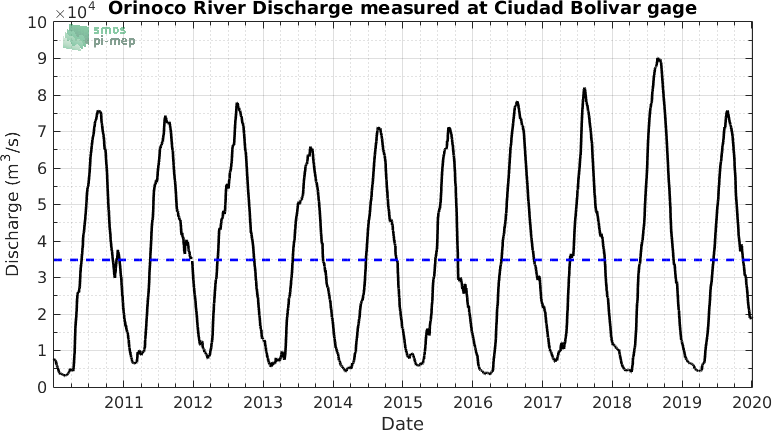
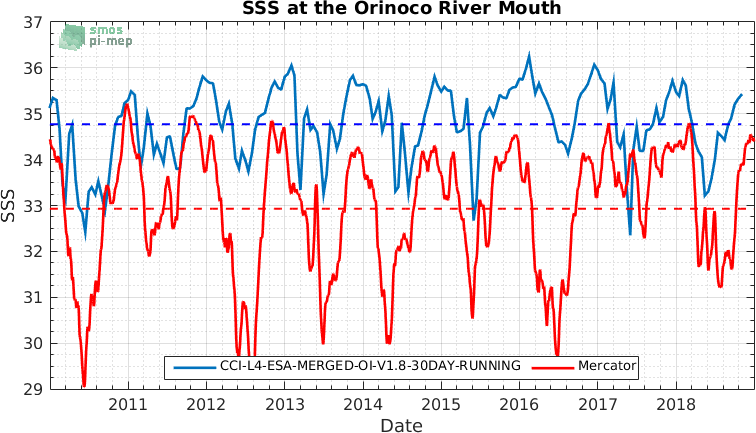
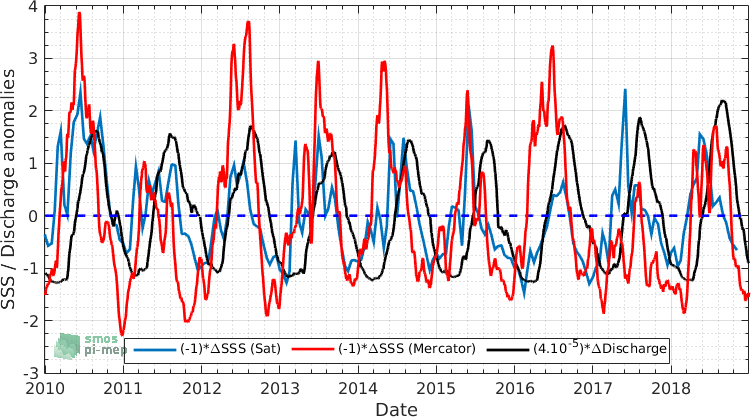
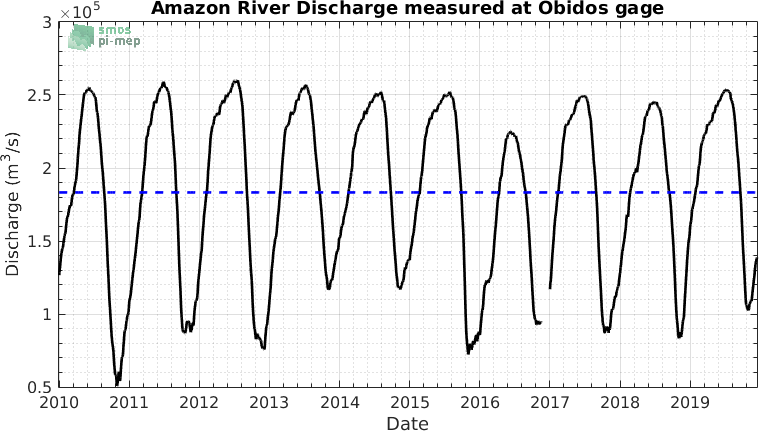
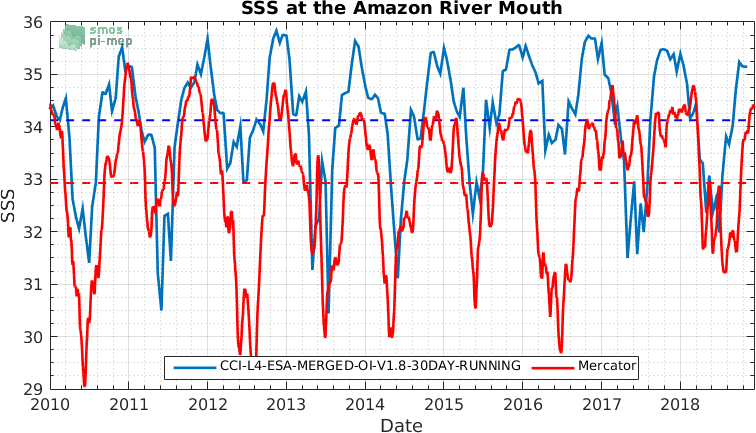
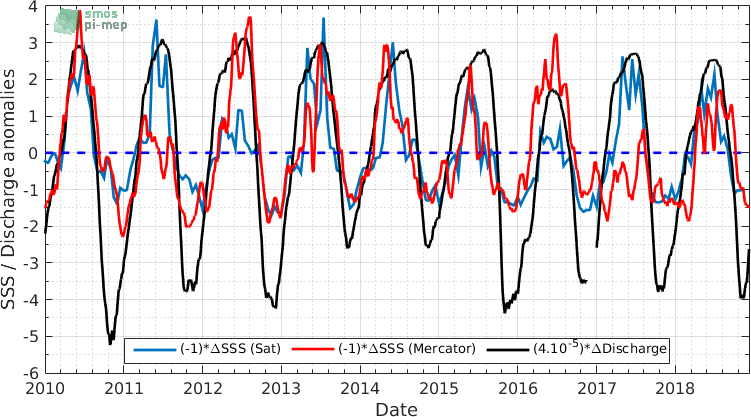
User can also generate plots of the time series as shown in Fig 3 and 4 below at the Amazon and Orinoco river mouth by selecting the satellite product in the menu below (the plots will update accordingly)
Amazon River Plume
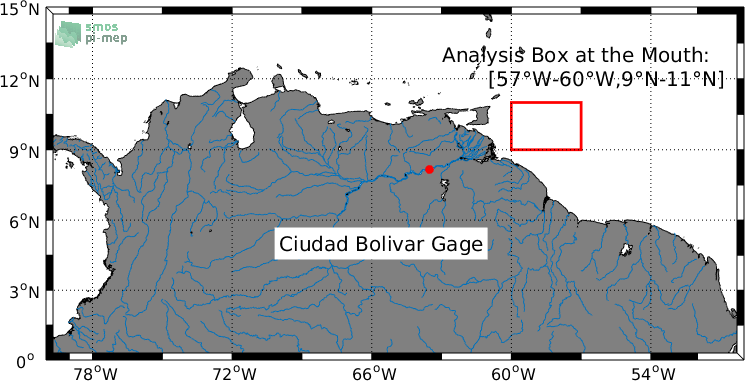
Orinoco River Plume