Vertical stratification
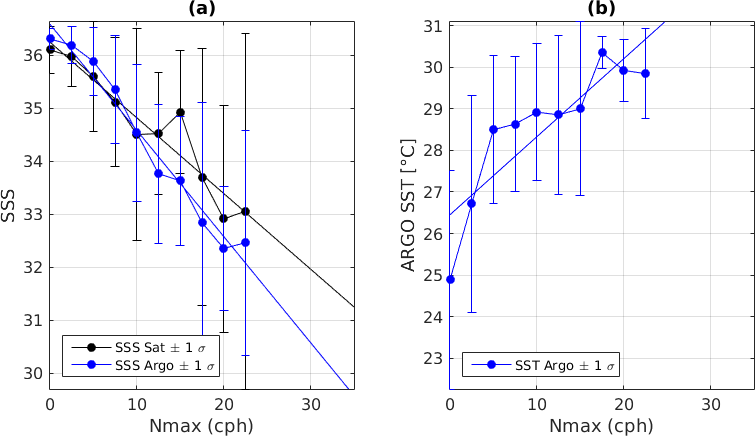
To investigate the capability of the satellite SSS estimates to help monitor the horizontal distribution of the vertical density stratification over the river plume waters, we look if the satellite SSS and/or SST values in the plume waters can be used as proxies for the strength of the vertical stratification below the plume and surrounding waters as determined from ARGO floats. SSS and SST were binned averaged as function of the maximum (along the vertical) buoyancy frequency at co-located ARGO/Satellite points with bins of width 2.5 cph and by default, the CCI-L4-ESA-MERGED-OI-V1.8-30DAY-RUNNING satellite SSS product is used for illustration covering 2010-2018.