Satellite SSS in the Bay of Bengal : the Ganga-Brahmaputra river plumes
Literature Review
Overview
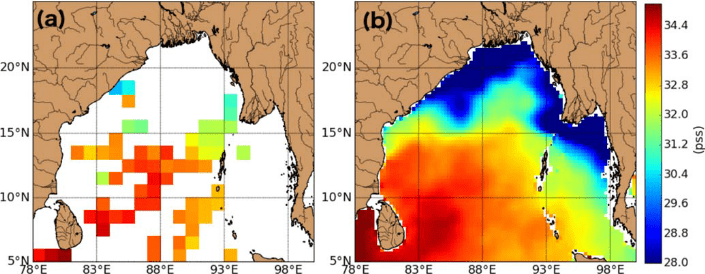
Bottom : (a) September–November 2015 in situ SSS measurements averaged within 1° pixels and (b) September–November 2015 average map of SMAP SSS. From Fournier et al. 2017
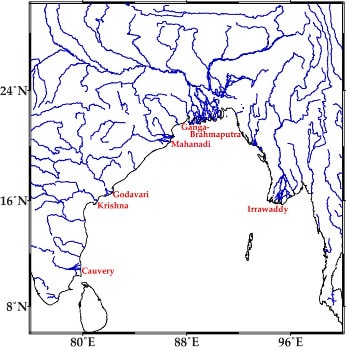
Monsoonal rains feed several powerful rivers that flow into the Bay of Bengal (BoB), with largest discharge during and shortly after the southwest monsoon. The Ganga-Brahmaputra (GB) River located in the very northern end of the BoB is the largest by far, accounting for two-thirds of the total river discharge into the BoB (1,300 km3 climatologically during June–September) (Dai & Trenberth, 2002; Papa et al., 2012). Oceanic rainfall also contributes in equal proportion to the total freshwater received by the northern BoB (Chaitanya et al., 2014). Consequently, the BoB stands out as the freshest marginal sea in the tropics (Chaitanya et al., 2014), with SSS being as low as 25 pss (Wijesekera et al., 2016) and displaying sharp horizontal gradients (Sengupta et al., 2016).
These low SSS can impact air-sea interactions in the BoB by maintaining a thin mixed layer and favoring the formation of an isothermal salinity-stratified layer between the surface mixed layer and colder thermocline water, known as the barrier layer (Rao & Sivakumar, 2003; Vinaychandran et al., 2002). This strong salinity stratification inhibits vertical mixing between the surface mixed layer and subsurface colder, nutrient-rich water (Thadathil et al., 2016; Vialard & Delecluse, 1998). This maintains high climatological surface temperatures, above the 28°C threshold necessary for deep atmospheric convection, contributing to the climatologically strong rainfall during the southwest monsoon (Shenoi et al., 2002). This also limits cooling below tropical cyclones (Neetu et al., 2012; Sengupta et al., 2008), which can favor their intensification (Cione & Uhlhorn, 2003). Finally, the strong salinity stratification could be one of the reasons for the rather low BoB biological productivity compared to the Arabian Sea (Prasanna Kumar et al., 2002). Previous studies have shown that there is a strong seasonal (Akhil et al., 2014) and interannual (Akhil et al., 2016b; Chaitanya et al., 2015) SSS variability in the BoB. It is hence necessary to better monitor the BoB SSS, in order to improve the understanding of salinity impacts on regional climate, tropical cyclones, and biological productivity.
Ocean currents play a prominent role in the BoB SSS space-time variations. In particular, the BoB hosts a western boundary current known as the East Indian Coastal Current (EICC). The EICC reverses seasonally (Yu et al., 1991) in response to the combined influence of local BoB and remote equatorial monsoonal winds (McCreary et al., 1996). It flows southward with a speed of approximately 0.5 m s21 during the October–December period (Durand et al., 2009) due to the combined effect of northeasterlies associated with the winter monsoon and remote forcing from intermonsoon equatorial westerlies (McCreary et al., 1996). The EICC is confined to the western boundary, with a narrow climatological width of less than 50 km north of 10°N, although frequent occurrence of eddies in this region often induces wider ~150–200 km recirculating loops (Durand et al., 2009).
The EICC flows past the GB River mouth. This is expected to transport the GB-induced freshwater southward along the east coast of India (Chaitanya et al., 2014). Shetye et al. (1996) documented such a narrow coastal freshwater plume southwest of the GB mouth based on in situ observations collected during a cruise in December 1991, with an 8 pss drop over 100 km toward offshore at 128N near the Indian coast. Hareesh Kumar et al. (2013) also used in situ measurements to highlight a strong thermohaline front off the east coast of India in December 1997, with an offshore meandering due to mesoscale eddies. Recently, Chaitanya et al. (2014) used in situ observations collected by fishermen along the east coast of India to demonstrate that this ~200 km wide freshwater tongue (referred to as a "river in the sea") is a seasonally recurring feature, whose expansion is coincidental with the development of the southward-flowing EICC. The modeling study by Akhil et al. (2014) confirmed that the "river in the sea" expands southward due to advection of low salinities from the GB outflow region by the EICC, while its decay is due to erosion through vertical mixing.
In addition to seasonal variations, the BoB climate also exhibits strong precipitation and runoff interannual variations (Papa et al., 2012). This led Akhil et al. (2016b) to investigate the causes of the SSS interannual variability in the BoB. They found that interannual variations in GB runoff only contribute to interannual SSS variations locally near the river mouth in the northern BoB. In contrast, the southward expansion of the "river in the sea" is strongly influenced by circulation changes associated with the Indian Ocean Dipole (IOD). The IOD arises from air-sea interactions in the tropical Indian Ocean, peaks in fall and typically lasts for about 6 months. A positive IOD is associated with anomalous easterly equatorial winds (opposite for negative IOD) that force equatorial upwelling Kelvin waves. Upon reaching the eastern equatorial Indian Ocean, some of this wave energy propagates into the BoB as coastal upwelling Kelvin waves, inducing a negative sea level anomaly (SLA) along the rim of the bay in fall, and an anomalously weak EICC during fall and winter months (Jensen, 2007; Shankar, 1998; Subrahmanyam et al., 2011). Akhil et al. (2016b) showed that this weak EICC transports less water from the GB outflow toward the south, resulting in a weaker southward expansion of the "river in the sea" and a positive SSS anomaly along the coast of India.
Despite the increasing amount of in situ observations, they are still too sparse to provide a systematic and routine monitoring of the spatiotemporal variability of this ~200 km wide "river in the sea" (Chaitanya et al.,2014) and more generally of the BoB SSS variability, even at the seasonal scale. Spaceborne SSS observations from recent satellite missions are unique opportunities to provide the first synoptic views of the "river in the sea" at the scale of the BoB, and to monitor its seasonal and interannual variations.
The advent of satellite measurements of sea surface salinity (SSS) provides a unique opportunity to study the spatio-temporal behavior of SSS in association with large river plumes in the BoB from synoptic to interannual timescales. A brief summary of the major published science involving satellite SSS and the monitoring of the SSS in the BoB are given in the sections here below.
Seasonal SSS variability in the BoB
A long-period (15 yr) simulation of SSS obtained from a hindcast run of an ocean general circulation model (OGCM) forced by the NCEP–NCAR daily reanalysis product was analyzed in Sharma et al. (2010) in the tropical Indian Ocean (TIO). The objective of the study was twofold: assess the capability of the model to provide realistic simulations of SSS and characterize the SSS variability in view of preparing the upcoming satellite salinity missions. Model fields were evaluated in terms of mean, standard deviation, and characteristic temporal scales of SSS variability. Results show that the standard deviations range from 0.2 to 1.5 psu, with larger values in regions with strong seasonal transitions of surface currents (south of India) and along the coast in the Bay of Bengal (strong Kelvin-wave-induced currents). Comparison of simulated SSS with collocated SSS measurements from the National Oceanographic Data Center and Argo floats resulted in a high correlation of 0.85 and a root-mean-square error (RMSE) of 0.4 psu. The correlations are quite high (>0.75) up to a depth of 300 m. Daily simulations of SSS compare well with a Research Moored Array for African–Asian–Australian Monsoon Analysis and Prediction (RAMA) buoy in the eastern equatorial Indian Ocean (1.5°S, 90°E) with an RMSE of 0.3 psu and a correlation better than 0.6. Model SSS compares well with observations at all time scales (intraseasonal, seasonal, and interannual). The decorrelation scales computed from model and buoy SSS suggest that the proposed 10-day sampling of future salinity sensors would be able to resolve much of the salinity variability at time scales longer than intraseasonal. This inference is significant in view of satellite salinity sensors, such as Soil Moisture and Ocean Salinity (SMOS) and Aquarius.
The seasonal variability of salinity transport in the Indian Ocean was also investigated by Nyadjro et al. (2011) using the high‐resolution global HYbrid Coordinate Ocean Model (HYCOM) by . Mechanisms and physical parameters that control the salinity budget were examined. Results show the influence of freshwater forcing and zonal advection as the dominant mechanisms of SSS variability. Precipitation is highest in the eastern Bay of Bengal (BoB), where it shows seasonal variation, and in the south equatorial eastern Indian Ocean (EIO), where it was consistently high year‐round. These patterns result in significant seasonal variation in the SSS in the BoB and almost no variation in the EIO. Zonal SSS transport was higher than meridional SSS transport with the strongest seasonality observed along the Sri Lankan region. Results of depth‐integrated transport show northward salt transport in the bottom layers and a southward salt transport in the surface layers. The 4 year mean net flux of depth‐integrated salt transport was southward (−154.8 × 10⁶ kg/s to −552.4 × 10⁶ kg/s) at all latitudes except at 20°N, where it was northward (396 × 106 kg/s). Transport generally increases southward with the highest transports occurring in the south (10°S–35°S) and a maximum at 30°S. Analyses of meridional Ekman volume and salt transport show a predominantly southward transport, an indication of the strong influence of SW monsoonal winds. This study can be useful in computing salt transport using satellite‐derived salinity data.
Analyses using a suite of observational datasets (Aquarius and Argo) and model simulations were carried out in D'Addezio et al. (2015) to examine the seasonal variability of salinity in the northern Indian Ocean (NIO). The model simulations include Estimating the Circulation and Climate of the Ocean, Phase II (ECCO2), the European Centre for Medium-Range Weather Forecasts–Ocean Reanalysis System 4 (ECMWF–ORAS4), Simple Ocean Data Assimilation (SODA) reanalysis, and the Hybrid Coordinate Ocean Model (HYCOM). The analyses of salinity at the surface and at depths up to 200 m, surface salt transport in the top 5-m layer, and depth-integrated salt transports revealed different salinity processes in the NIO that are dominantly related to the semiannual monsoons. Aquarius proves a useful tool for observing this dynamic region and reveals some aspects of SSS variability that Argo cannot resolve. The study revealed large disagreement between surface salt transports derived from observed- and analysis-derived salinity fields. Although differences in SSS between the observations and the model solutions are small, model simulations provide much greater spatial variability of surface salt transports due to finer detailed current structure. Meridional depth-integrated salt transports along 6°N revealed dominant advective processes from the surface toward near-bottom depths. In the Arabian Sea (Bay of Bengal), the net monthly mean maximum northward (southward) salt transport of ~50 × 106 kg s−1 occurs in July, and annual-mean salt transports across this section are about −2.5 × 10⁶ kg s−1 (3 × 10⁶ kg s−1).
An in situ gridded data of salinity, comprising Argo and CTD profiles, has been used by Pant et al. (2015) to study the interannual variability of near‐surface salinity (within 30 m from sea surface) in the Bay of Bengal (BoB) during the years 2005–2013. Level‐3 SSS data derived from Aquarius satellite during the overlapping period (2011–2013) was also used to examine the temporal evolution of sea surface salinity observed in Argo gridded product. In addition to the broad agreement with earlier studies on the north‐to‐south gradient of surface salinity and general features of seasonal variability of salinity, the data also revealed few episodes of enhanced freshening in the BoB. The observations showed distinct anomalous low salinity (< 2 psu) waters in the northern BoB during June–February of the years 2006–2007, 2011–2012 , and 2012–2013. The anomalous freshening during these years showed similar life cycle, such as, it starts in the northern BoB during July–September of current summer and extends up to February–March of next winter with a southward propagation. Analysis showed that the oceanic and atmospheric conditions associated with positive Indian Ocean Dipole (pIOD) lead to these freshening events, and IOD rather than El Niño/Southern Oscillation (ENSO) controls the interannual variability of salinity in the BoB. The mixed layer salt budget analysis indicated the dominant role of local freshwater flux (horizontal advection) on the observed salinity tendency during summer (winter) monsoon season. Enhanced precipitation associated with pIOD lead to enhanced freshening in northern BoB during June–September, which remained to this region with prevailing summer monsoon circulation. The weakening or absence of southward east India coastal current (EICC) during October–December of these freshening years trapped anomalous freshwater in the northern BoB.
Recent observational studies provided preliminary insights on the interannual variability of Bay of Bengal (BoB) SSS, but are limited by the poor data coverage. Akhil et al. (2016) described the BoB interannual SSS variability and its driving processes from a regional eddy‐permitting ocean general circulation model forced by interannually varying air‐sea fluxes and altimeter‐derived discharges of major rivers over the past two decades. Simulated interannual SSS variations compare favorably with both in situ and satellite data (from Aquarius) and are largest in boreal fall in three regions: the northern BoB, the coastal region off east India, and the Andaman Sea. In the northern BoB, these variations are independent from those in other regions and mostly driven by summer‐fall Ganga‐Brahmaputra runoff interannual variations. In fall, remote forcing from the Indian Ocean Dipole results in anticlockwise anomalous horizontal currents that drive interannual SSS variations of opposite polarity along the east coast of India and in the Southern Andaman Sea. From winter onward, these anomalies are damped by vertical mixing in the northern BoB and along the east coast of India and by horizontal advection in the Southern Andaman Sea. While river runoff fluctuations locally play a strong role near the Ganga‐Brahmaputra river mouth, wind‐driven interannual current anomalies are responsible for a large fraction of SSS interannual variability in most of the basin.
Satellite SSS data validation in the Indian Ocean
SSS measurement from Aquarius/SAC‐D satellite reveals strong seasonal variability in the tropical Atlantic and Indian Oceans. As discussed in Moon and Song, 2014, the seasonal SSS variability at skin layer differs/agrees regionally in their amplitude from/with Argo‐measured salinity at 5 m depth and model salinity at the top layer, indicating various characteristics of near‐surface salinity stratifications. By comparing the three different salinity products, we have examined the near‐surface salinity stratifications with emphasis on the dynamical processes that differ from one region to another. Our analysis shows that for the western part of tropical Atlantic and southern tropical Indian, a large amount of river runoff and/or surface freshwater significantly stratifies the surface layer above 5 m depth, resulting in the differences among the Aquarius, Argo, and model. Differently for the southern Arabian Sea, the surface water can be mixed down to the depth of 5 m due to seasonally reversing currents driven by monsoons, resulting in an agreement among the data sets. The comparison suggests that dynamical differences can lead to different vertical salinity stratifications locally, which explain the differences between the Aquarius observations in the first cm of the sea surface, the Argo measurements at the 5 m depth, and model's representation of the surface‐layer averaged salinity.
Validation of SSS derived by Aquarius mission has been performed by Ratheesh et al. (2014) on daily level-3 SSS data obtained in the Indian Ocean region during 2011-12. The in situ data sets available from Argo floats have been utilized for this purpose. The coefficient of determination between SSS and reference measurements is 0.84 and root mean square difference (RMSD) is about 0.45 psu. Spatial distributions of average salinity and variability of salinity have been found to agree reasonably well with the known features of SSS in this ocean basin. Under the assumption that the autocorrelation of SSS anomaly has anisotropic Gaussian characteristics, the authors also evaluated the space-time decorrelation scales of this anomaly, with the usual definition that decorrelation scales are the e-folding scales of SSS anomalies.
Daily, weekly, and monthly Aquarius SSS data between September 2011 and August 2013 from the tropical Indian Ocean (TIO) were compared with the surface most salinity observations (<5 m) from Argo floats in Bhaskar et al. (2015). Statistics between a daily reporting Argo float (WMO 2901329) and daily Aquarius SSS resulted in a root-mean-square error (RMSE), a bias, and a correlation of 0.32 psu, 0.02 psu, and 0.81, respectively. Weekly 1° × 1° spatial resolution SSS was produced from the Argo data using variational analysis and was compared with Aquarius SSS data. RMSE was observed to be between 0 and 0.25 psu over most of the region. Bias was observed to be within 0.3 psu everywhere, except in the southeastern Arabian Sea and the southeastern TIO. Good correlation (> 0.6) was observed everywhere, except the coast of Oman, western equatorial Indian Ocean, and south of 20° S. A seasonal comparison has also revealed that both Aquarius and Argo are in agreement; in addition, the Aquarius SSS clearly shows the seasonal salinity cycle of the TIO.
In a study by Momin et al. (2015), SSS variability in the tropical Indian Ocean (TIO) was analysed using the Aquarius instrument and in situ observations from the Research Moored Array for African–Asian–Australian Monsoon Analysis and Prediction (RAMA) buoys and Array for Real-Time Geostrophic Oceanography (ARGO) datasets for the period 2012–2013. Comparison of two versions (V2 and V3) of Aquarius-based SSS estimates to nine RAMA buoys on a daily time scale showed excellent mutual agreement. The systematic underestimation of SSS by satellite-based V2 products over the TIO shows a clear advantage for the new version product (V3). A larger root-mean-square error of the order of 0.50 psu in the satellite-based SSS was observed over the highly variable (larger standard deviation) Bay of Bengal region as compared with ARGO data sets. In the eastern equatorial Indian Ocean region, satellite-based SSS overestimated SSS below 34 psu and underestimated SSS of 34–35 psu as compared with ARGO data. However, the V3 SSS from Aquarius showed marginal improvement over V2 SSS. Monthly variation and fast Fourier analysis of the satellite-based SSS estimates are in reasonably good agreement with in situ observations which suggest that Aquarius is able to capture SSS variability in the TIO. The Aquarius-based V3 SSS showed a temporal autocorrelation of 0.6 over most parts of the TIO up to day 10, and decreased gradually with time. Overall analysis suggests that Aquarius-derived V3 SSS can detect variability in SSS satisfactorily in the TIO and is in reasonably good agreement with in situ observations.
The Bay of Bengal (BoB) exhibits a wide range of SSS, with very fresh water induced by heavy monsoonal precipitation and river run-offs to the north, and saltier water to the south. This is a particularly challenging region for the application of satellite-derived SSS measurements because of the potential pollution of the SSS signal by radio frequency interference (RFI) and land-induced contamination in this semi-enclosed basin. A study by Akhil et al. (2016) validated recent level-3 monthly gridded (1° × 1°) SSS products from Soil Moisture and Ocean Salinity (SMOS) and Aquarius missions to an exhaustive in situ SSS product for the BoB. SMOS SSS retrievals (as produced at the time) do not perform better than existing climatologies. This is in stark contrast to Aquarius, which outperforms SMOS and available SSS climatologies everywhere in the BoB. While SMOS only captures the SSS seasonal evolution in the northern part of the Bay, Aquarius accurately captures the seasonal signal in the entire basin. The Aquarius product is also able to capture SSS non-seasonal anomalies, with an approximate correlation (r) of 0.75 with box-averaged in situ data in the northern, central, and western parts of the Bay. Aquarius can, thus, be confidently used to monitor large-scale year-to-year SSS variations in the BoB.
A paper by Momin et al. (2016) highlighted the results of release Aquarius V4, and version 3 (V3) data with Argo observations on monthly time scale from 2012-2014 periods in the Tropical Indian Ocean. The spatial distribution of mean SSS shows that both products capture the SSS variation very well. The Aquarius V4 SSS showed minor improvement over the Aquarius V3 SSS with less root mean square error over the central & eastern equatorial Indian Ocean (EEIO) & part of Bay of Bengal (BOB). The frequency distribution is also improved in Aquarius V4 compare to Aquarius V3 average over the different regions. However, both the versions overestimates/underestimates the frequency of low/high salinity values.
SSS retrieved from SMAP radiometer measurements were validated against in situ salinity from Argo floats, tropical moored buoys and ship-based thermosalinograph (TSG) data in Tang et al. (2017). SMAP SSS achieved an accuracy of 0.2 PSU on a monthly basis in comparison with Argo gridded data in the tropics and mid-latitudes. In the tropical oceans, time series comparison of salinity measured at 1 m by moored buoys indicates that SMAP can track large salinity changes occurred within a month. Synergetic analysis of SMAP, SMOS and Argo data allows us to identify and exclude erroneous jumps or drift in some real-time buoy data from the assessment of the satellite data. The resulting SMAP-buoy matchup analysis gives an average standard deviation of 0.22 PSU and correlation coefficient of 0.73 on weekly scale. On monthly time scales, the average standard deviation reduced to 0.17 PSU and the correlation coefficient improved to 0.8. SMAP L3 daily maps reveals salty water intrusions from the Arabian Sea into the Bay of Bengal during the Indian summer monsoon, consistent with the daily measurements collected from Argo floats deployed during the Bay of Bengal Boundary Layer Experiment (BoBBLE) project field campaign.
Satellite SSS and Indian Ocean Dipole
An ocean reanalysis that covers the period from 1871 to 2008 was used in Grunseich et al. (2011) to analyze the interannual variability of SSS in the tropical Indian Ocean. The reanalysis SSS and the SSS anomaly patterns during Indian Ocean Dipole (IOD) and El Niño–Southern Oscillation (ENSO) events were compared with patterns from Argo SSS data. The mean seasonal SSS variation is large in the northern Bay of Bengal compared with variations in the Arabian Sea and equatorial Indian Ocean. During a positive IOD event, positive SSS anomalies are found along the Sumatra coast that are due to the combination of wind‐driven upwelling of subsurface high‐salinity waters, enhanced evaporation, and anomalous surface circulation. The opposite is true, to a lesser extent, during negative IOD events. A dipole mode index for salinity (DMIS) based on SSS data and a new index based on the average of salinity in a region off the coast of Sumatra are introduced to monitor SSS variability during IOD and ENSO events. The impact of concomitant El Niño events on a positive IOD event is large with freshening (a negative SSS anomaly) in the equatorial Indian Ocean and salting (positive SSS anomaly) off the southern Sumatra coast. The (impact of) intense freshening reaches into the southwestern tropical Indian Ocean. The impact of concomitant La Niña with negative IOD is also large with an intense freshening in the southeastern Arabian Sea and salting off the northern Sumatra coast.
Durand et al. (2013) showed that SMOS data can be used to infer the pattern of salinity variability linked with the IOD events. The core of maximum variability is located in the central tropical basin, south of the equator. This region is anomalously salty during the 2010 negative IOD event, and anomalously fresh during the 2011 positive IOD event. The peak-to-peak anomaly exceeds one salinity unit, between late 2010 and late 2011. In conjunction with other observational datasets, SMOS data allow us to draw the salt budget of the area. It turns out that the horizontal advection is the main driver of salinity anomalies. This finding is confirmed by the analysis of the outputs of a numerical model. This study shows that the advent of SMOS makes it feasible the quantitative assessment of the mechanisms of ocean surface salinity variability in the tropical basins, at interannual timescales.
A study by Du and Zhang (2015) investigated SSS variations in the tropical Indian Ocean (IO) using the Aquarius/Satelite de Aplicaciones Cientificas-D (SAC-D) and the Soil Moisture and Ocean Salinity (SMOS) satellite data and the Argo observations during July 2010–July 2014. Compared to the Argo observations, the satellite datasets generally provide SSS maps with higher space–time resolution, particularly in the regions where Argo floats are sparse. Both Aquarius and SMOS well captured the SSS variations associated with the Indian Ocean dipole (IOD) mode. Significant SSS changes occurred in the central equatorial IO, along the Java–Sumatra coast, and south of the equatorial IO, due to ocean circulation variations. During the negative IOD events in 2010, 2013, and 2014, westerly wind anomalies strengthened along the equator, weakening coastal upwelling off Java and Sumatra and decreasing SSS. South of the equatorial IO, an anomalous cyclonic gyre changed the tropical circulation, which favored the eastward high-salinity tongue along the equator and the westward low-saline tongue in the south. An upwelling Rossby wave favored the increase of SSS farther to the south. During the positive IOD events in 2011 and 2012, the above-mentioned processes reversed, although the decrease of SSS was weaker in magnitude.
A high resolution ocean general circulation model with a horizontal resolution of 10 Km was used by Mishra et al. (2015) to investigate salinity in the Northern Indian Ocean [65E-95E; 5N-20N]. The model simulated salinity during the years 1998-2014 was compared against the satellite and in-situ observations. The model is able to capture the contrasting distributions of sea surface salinity (SSS) in the Arabian Sea and the Bay of Bengal. The Bay of Bengal salinity values are generally lower than the Arabian Sea. The model is also able to reproduce the strong seasonality of the sea surface salinity in the changing climate. The inter-annual SSS variability is 2-4 times smaller than seasonal variability in the region of study. The regions of large inter-annual variability are located near river mouths in the Bay of Bengal. The inter-annual variability of the SSS in the northern Indian ocean is also examined in the light of recent changes in the El Nino-Southern Oscillation (ENSO), Indian Ocean Dipole (IOD) during the period of study. The relative role of wind and solar radiation on the sea surface salinity was also investigated.
Estimation of subsurface properties using satellite SSS measurements
Monthly barrier layer thickness (BLT) estimates were derived by Felton et al. (2014) from satellite measurements using a multilinear regression model (MRM) within the Indian Ocean. Sea surface salinity (SSS) from the SMOS and Aquarius SAC‐D salinity missions were utilized to estimate the BLT. The MRM relates BLT to sea surface salinity (SSS), sea surface temperature (SST), and sea surface height anomalies (SSHA). Three regions where the BLT variability is most rigorous are selected to evaluate the performance of the MRM for 2012; the Southeast Arabian Sea (SEAS), Bay of Bengal (BoB), and Eastern Equatorial Indian Ocean (EEIO). The MRM derived BLT estimates are compared to gridded Argo and Hybrid Coordinate Ocean Model (HYCOM) BLTs. It is shown that different mechanisms are important for sustaining the BLT variability in each of the selected regions. Sensitivity tests show that SSS is the primary driver of the BLT within the MRM. Results suggest that salinity measurements obtained from Aquarius and SMOS can be useful for tracking and predicting the BLT in the Indian Ocean. Largest MRM errors occur along coastlines and near islands where land contamination skews the satellite SSS retrievals. The BLT evolution during 2012, as well as the advantages and disadvantages of the current model are discussed. BLT estimations using HYCOM simulations display large errors that are related to model layer structure and the selected BLT methodology.
Schiller and Oke (2015) presented a new methodology that allows quantifying the impact of individual terms of the temperature and salinity conservation within the mixed layer on mixed layer depth (MLD). The method was applied to output from an ocean general circulation model in the Indian Ocean to investigate variability and changes in MLD. On seasonal timescales and for most areas of the Indian Ocean variability of MLD is tightly linked to all thermohaline budget terms. In the Indian Ocean at approximately 20°S the MLD covaries with surface heat and freshwater fluxes on intraseasonal and interannual timescales. The geography of the region includes the Leeuwin Current, plus the tropical eastern Indian Ocean for interannual surface freshwater fluxes. The range of seasonal amplitudes of MLD variability varies with individual budget terms but is typically within 1 m/month to 100 m/month. The ocean footprints of an intraseasonal tropical cyclone, tropical and midlatitude seasonal temperature and salinity budgets and interannual variability associated with the Indian Ocean Dipole Mode are analyzed. The results reveal close relationships of the thermohaline budgets within the mixed layer with the variability of the MLD. The associated tendencies of changes in MLD are consistent with Argo and satellite‐based observations of tendencies within the mixed layer and sea‐surface temperature and salinity.
Estimating the thermal information in the subsurface and deeper ocean from satellite measurements over large basin-wide scale is important but also challenging. Su et al. (2015) proposed a support vector machine (SVM) method to estimate subsurface temperature anomaly (STA) in the Indian Ocean from a suite of satellite remote sensing measurements including sea surface temperature anomaly (SSTA), sea surface height anomaly (SSHA), and sea surface salinity anomaly (SSSA) estimated from SMOS and Aquarius. The SVM estimation of STA features the inclusion of in-situ Argo STA data for training and testing. SVM, one of the most popular machine learning methods, can well estimate the STA in the upper 1000 m of the Indian Ocean from satellite measurements of sea surface parameters (SSTA, SSHA and SSSA as input attributes for SVM). The results, based on the common SVM application of Support Vector Regression (SVR), were validated for accuracy and reliability using the Argo STA data. Both MSE and r2 for performance measures are improved after including SSSA for SVR (MSE decreased by 12% and r2 increased by 11% on average). The results showed that SSSA, in addition to SSTA and SSHA, is a useful parameter that can help detect and describe the deeper ocean thermal structure, as well as improve the STA estimation accuracy. Moreover, our method can provide a useful technique for studying subsurface and deeper ocean thermal variability which has played an important role in recent global surface warming hiatus since 1998, from satellite measurements in large basin-wide scale.
The strong salinity stratification in the upper 50–80 m of the Bay of Bengal affects the response of the upper ocean to surface heat fluxes. Using observations from November to December 2013, Mahadevan et al. (2016) examined the effect of surface cooling on the temperature structure of the ocean in a one-dimensional framework. The presence of freshwater adds gravitational stability to the density stratification and prevents convective overturning, even when the surface becomes cooler than the subsurface. This stable salinity stratification traps heat within subsurface layers. The ocean’s reluctance to release the heat trapped within these subsurface warm layers can contribute to delayed rise in surface temperature and heat loss from the ocean as winter progresses. Understanding the dispersal of freshwater throughout the bay can help scientists assess its potential for generating the anomalous temperature response. We use the Aquarius along-track surface salinity and satellite-derived surface velocities to trace the evolution and modification of salinity in the Lagrangian frame of water parcels as they move through the bay with the mesoscale circulation. This advective tracking of surface salinities provides a Lagrangian interpolation of the monthly salinity fields in 2013 and shows the evolution of the freshwater distribution. The along-trajectory rate of salinification of water as it leaves the northern bay is estimated and interpreted to result from mixing processes that are likely related to the host of submesoscale signatures observed during our field campaigns.
Monitoring sea water intrusion into the Cochin estuary
Thermohaline variability in the Cochin estuary primarily depends on the mixing of fresh water downstream and sea water intrusion upstream. Knowledge of sea water intrusion into the estuary is important for functioning of ecological systems. A study conducted by Rao and Anilkumar (2015) explored the possibility of monitoring seawater intrusion into the estuary using open ocean thermohaline properties obtained from Aquarius SSS satellite data. Recently, an extensive observational program has been carried out during 2011 and 2012 in the Cochin estuary to collect temperature and salinity profiles on a fortnightly interval with a station spacing of approximately 100m. Notable temporal variability in salinity is observed in the depth time plots constructed using profiles collected during high tide. Salinity intrusion into Harbor Mouth, during summer and winter monsoon period, exhibits considerable year to year variability. The retreat of summer monsoon rainfall and reduction in the freshwater water discharge resulted in a gradual increase in the salinity both in the surface and bottom. Earlier studies reported that the thermohaline variability on semi-diurnal and diurnal scales is solely due to tidal inflow and outflow. This study looked into the influence of open ocean thermohaline properties around inlet as observed in the Sea Surface Salinity and Sea Surface Temperature derived from satellite data on the salinity variability in the estuary.
Mesoscale features in the BoB detected by Satellite SSS
As reported in Gordon et al (2016), the upper 200 m of the two northern Indian Ocean embayments, the Bay of Bengal (BoB) and the Arabian Sea (AS), differ sharply in their salinity stratification, as the Asian monsoon injects massive amounts of freshwater into the BoB while removing freshwater via evaporation from the AS. The ocean circulation transfers salt from the AS to the BoB and exports freshwater from the BoB to mitigate the salinity difference and reach a quasi-steady state, albeit with strong seasonality. An energetic field of mesoscale features and an intrathermocline eddy was observed within the BoB during the R/V Revelle November and December 2013 Air-Sea Interactions Regional Initiative cruises, marking the early northeast monsoon phase. Mesoscale features, which display a surprisingly large thermohaline range within their confines, obscure the regional surface water and thermohaline stratification patterns, as observed by satellite and Argo profilers. Ocean processes blend the fresh and salty features along and across density surfaces, influencing sea surface temperature and air-sea flux. Comparing the Revelle observations to the Argo data reveals a general westward migration of mesoscale features across the BoB.
A thin layer of fresh water from summer monsoon rain and river runoff in the Bay of Bengal (BoB) has profound influence on air‐sea interaction across the south Asian region, but the mechanisms that sustain the low‐salinity layer are as yet unknown. Using the first long time series of high‐frequency observations from a mooring in the north BoB and satellite salinity data, Sengupta et al. (2016) show that fresh water from major rivers is transported by large‐scale flow and eddies, and shallow salinity stratification persists from summer through the following winter. The moored observations show frequent 0.2–1.2 psu salinity jumps with time scales of 10 min to days, due to O(1–10) km submesoscale salinity fronts moving past the mooring. In winter, satellite sea surface temperature shows 10 km wide filaments of cool water, in line with moored data. Rapid salinity and temperature changes at the mooring are highly coherent, suggesting slumping of salinity‐dominated fronts. Based on these observations, we propose that submesoscale fronts may be one of the important drivers for the persistent fresh layer in the north BoB.
The Bay of Bengal receives large amounts of freshwater from the Ganga‐Brahmaputra (GB) river during the summer monsoon. The resulting upper‐ocean freshening influences seasonal rainfall, cyclones, and biological productivity. Sparse in situ observations and previous modeling studies suggest that the East India Coastal Current (EICC) transports these freshwaters southward after the monsoon as an approximately 200 km wide, 2,000 km long “river in the sea” along the East Indian coast. As discussed in Fournier et al. (2017), Sea surface salinity (SSS) from the Soil Moisture Active Passive (SMAP) satellite provides unprecedented views of this peculiar feature from intraseasonal to interannual timescales. SMAP SSS has a 0.83 correlation and 0.49 rms‐difference to 0–5 m in situ measurements. SMAP and in situ data both indicate a SSS standard deviation of ∼0.7 to 1 away from the coast, that rises to 2 pss within 100 km of the coast, providing a very favorable signal‐to‐noise ratio in coastal areas. SMAP also captures the strong northern BoB, post-monsoon cross‐shore SSS contrasts (∼10 pss) measured along ship transects. SMAP data are also consistent with previous modeling results that suggested a modulation of the EICC/GB plume southward extent by the Indian Ocean Dipole (IOD). Remote forcing associated with the negative Indian Ocean Dipole in the fall of 2016 indeed caused a stronger EICC and “river in the sea” that extended by approximately 800 km further south than that in 2015 (positive IOD year). The combination of SMAP and altimeter data shows eddies stirring the freshwater plume away from the coast.
Satellite estimate of freshwater exchange through the Indonesian Throughflow
The straits in Indonesia allow for low‐latitude exchange of water between the Pacific and Indian Oceans. Collectively known as the Indonesian Throughflow (ITF), this exchange is thought to occur primarily via the Makassar Strait and downstream via Lombok Strait, Ombai Strait, and Timor Passage. The Sunda Strait, between the islands of Sumatra and Java, is a very narrow ( ~10km) and shallow ( ~20m) gap, but it connects the Java Sea directly to the Indian Ocean. Flow through this strait is presumed to be small, given the size of the passage; however, as discussed in Potemra et al. (2016), recent observations from the Aquarius satellite indicate periods of significant freshwater transport, suggesting the Sunda Strait may play a more important role in Pacific to Indian Ocean exchange. The nature of this exchange is short‐duration (several days) bursts of freshwater injected into the eastern Indian Ocean superimposed on a mean seasonal cycle. The mean volume transport is small averaging about 0.1 Sv toward the Indian Ocean, but the freshwater transport is non negligible (estimated at 5.8 mSv). Transport through the strait is hydraulically controlled and directly correlates to the along‐strait pressure difference. The episodic low‐salinity plumes observed by Aquarius do not, however, appear to be forced by this same mechanism but are instead controlled by convergence of flow at the exit of the Strait in the Indian Ocean. Numerical model results show the fate of this freshwater plume varies with season and is either advected to the northwest along the coast of Sumatra or southerly into the ITF pathway.
Satellite SSS and Primary Production in the Bay of Bengal
Eddies can be important in sustaining primary production in the tropical oceans, but their role for nutrient cycling is poorly understood in the under-sampled northern Indian Ocean. To assess the role of cyclonic eddies in enhancing primary production, measurements of primary production were carried out at four stations in the northern Bay of Bengal during the early winter 2007, around a cyclonic eddy close to 17.8°N, 87.5°E and are reported in Singh, et al. (2015). Aquarius SSS was used to describe the synoptic large scale SSS. Shallowing of the thermocline and halocline by 10 m was observed within the eddy compared to the surroundings; mixed layer depth was also reduced within the eddy. The highest surface productivity (2.71 μM C d− 1) and chlorophyll a (0.18 μg L− 1) were found within the eddy, and the lowest, at its outer edge. Further, the eddy supplied nutrients to the surface layers, shallowing the subsurface chlorophyll maximum as well. Integrated production in the euphotic top layers was more than twice within the eddy compared to its outer edge, confirming the role of cyclonic eddies in enhancing the primary production in the otherwise less productive Bay of Bengal. Given new nitrogen input via vertical mixing, river discharge or aerosol deposition, the additional primary production due to this new nutrient input and its contribution to the total production (f-ratio, fraction of exportable organic matter) increased significantly from 0.4 to 0.7, and thus the Bay of Bengal can potentially transfer a high fraction of its total production to the deep, assisted by eddies.The authors suggest possible improvements in experiments for future studies, and the potential for assessing the role of eddies in biogeochemistry.
As discussed in Hood et al. (2017), Monsoon forcing and the unique geomorphology of the Indian Ocean basin result in complex boundary currents, which are unique in many respects. In the northern Indian Ocean, several boundary current systems reverse seasonally. For example, upwelling coincident with northward-flowing currents along the coast of Oman during the Southwest Monsoon gives rise to high productivity which also alters nutrient stoichiometry and therefore, the species composition of the resulting phytoplankton blooms. During the Northeast Monsoon most of the northern Indian Ocean boundary currents reverse and favor downwelling. Higher trophic level species have evolved behavioral responses to these seasonally changing conditions. Examples from the western Arabian Sea include vertical feeding migrations of a copepod (Calanoides carinatus) and the reproductive cycle of a large pelagic fish (Scomberomorus commerson). The impacts of these seasonal current reversals and changes in upwelling and downwelling circulations are also manifested in West Indian coastal waters, where they influence dissolved oxygen concentrations and have been implicated in massive fish kills. The winds and boundary currents reverse seasonally in the Bay of Bengal, though the associated changes in upwelling and productivity are less pronounced. Nonetheless, their effects are observed on the East Indian shelf as, for example, seasonal changes in copepod abundance and zooplankton community structure. In contrast, south of Sri Lanka seasonal reversals in the boundary currents are associated with dramatic changes in the intensity of coastal upwelling, chlorophyll concentration, and catch per unit effort of fishes. Off the coast of Java, monsoon-driven changes in the currents and upwelling strongly impact chlorophyll concentrations, seasonal vertical migrations of zooplankton, and sardine catch in Bali Strait.
Impact of Satellite SSS in improving ocean analysis over Indian Ocean
The distribution of ocean salinity controls the density field and thereby plays a major role in influencing the ocean dynamics. It has been a challenging task to understand the variability of salinity structure in the regions of large freshwater discharge and high precipitation such as Bay of Bengal (BoB). In Vivek Seelanki et al. (2018), the authors assimilated Aquarius SSS in the Global Ocean Data Assimilation System based on 3DVAR technique. The assimilation of Aquarius SSS resulted in reduced biases in salinity not only at the surface, but also in the vertical distribution of salinity and better captured the temporal variations of salinity structure in sensitive regions, such as the Bay of Bengal. In addition, the assimilation of SSS showed marginal improvement in ocean thermal structure over data sparse regions of Indian Ocean. It is also shown that the assimilation of Aquarius SSS has improved the stratification in the upper Ocean which is the key factor in the observed improvement in ocean analysis.