SSS, rain & winds
The spatio-temporal correlation between the different satellite SSS products and the rain rate (CMOPRH products) in the Amazon river plume region can be monitored using the syntool visualisation software available here
The spatio-temporal correlation between the different satellite SSS products and the wind speed in the Mississippi river plume region can be monitored using the merginator visualisation software available here
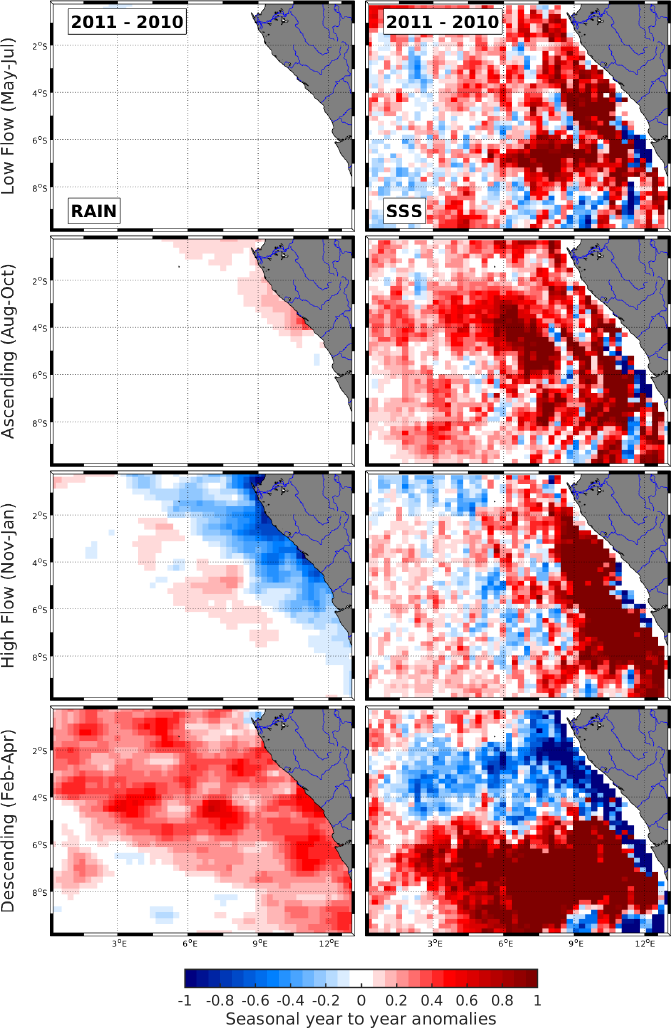
Here below, we show the seasonal spatial patterns anomalies from one year to another of precipitation (letf) and satellite SSS (right):