Satellite SSS, Congo River Plume
Literature Review
Overview
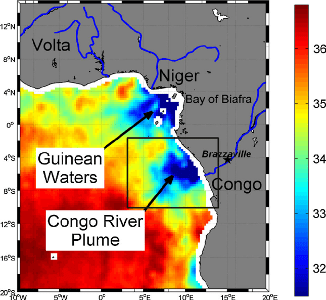
The eastern tropical Atlantic (ETA) Ocean 8°W–12°E, 6°N–20°S is a region of intense upwelling and where the second largest river in the world, the Congo, enters the ocean together with the Niger, Volta and numerous other smaller rivers. In addition, intense precipitations also decrease SSS in the Guinea current and northeastern Gulf of Guinea (Hisard 1980; Merle 1980). The ETA is therefore characterized with a highly complex hydrographic system, largely influenced by the Congo River, intense precipitation, and strong seasonal coastal and equatorial upwelling in the boreal summer. Maximum discharge from the Congo River occurs in December and minimum discharge in March through April. The outflow is hardly detectable from SST or sea level data. In chlorophyll, however, the mouth of the Congo River shows a strong signal all year round with large plumes extending offshore. While these ocean color signals highlight real oceanographic features of the plume, frequent cloud cover found in this region during the rainy season strongly inhibits the spatiotemporal evolution of the Congo plume structure to be monitored.
Until the satellite SSS era, the knowledge about the seasonal extension and spreading of the Congo River plume was therefore mainly relying on dedicated in situ surveys (e.g., see Meulenbergh 1968; Koleshnikov 1973; Bornhold 1973; Wauthy 1977; Van Bennekom and Jager 1978; Eisma and Van Bennekom 1978; Van Bennekom and Berger 1984; Piton and Wacongne 1985; Braga et al. 2004; Reverdin et al. 2007; Vangriesheim et al. 2009; Lefèvre 2009). However, the ensemble of in situ SSS data collected during the period 1977–2002 in the ETA is sparse, and only enabled retrievals of low-resolution (1°x1°) monthly climatology of the SSS field (Reverdin et al. 2007). Note that since 2003, the in situ SSS sampling has however improved with the increasing deployments and operations of Argo floats. Combining satellite information on surface currents, SST, rain rates and SSS together with river discharge levels certainly help to better quantify the sources of variability in the local hydrological cycle of the Gulf of Guinea and Congo mouth region. The terrestrial and atmospheric hydrological fluxes in this region also act as a dominant modulator of the local fishery. The regular SMOS, Aquarius and SMAP SSS data can therefore help to better understand the mechanisms involved in the biophysical interplay and its relevance for the fishery with potentially significant socioeconomic impact in that region. In the Congo River basin, loading tankers can be dangerous due to the strong current shear caused by the river plume. A good understanding of the spread of the plume and its variability allows a better planning of all operations and can be included in the determination of suitable metocean windows : this can be better achieved through the use of satellite SSS data.
The advent of satellite measurements of sea surface salinity (SSS) provides a unique opportunity to study the spatio-temporal behavior of SSS in association with large river plumes from synoptic to interannual time scales. A brief summary of the major published science involving satellite SSS and the monitoring of the Congo river plume are given in the sections here below.
Synergistic use of satellite SSS, SST, SLA and ocean Color to monitor the seasonal cycle of the Congo River plume
Despite its size and importance the dispersal, variability and dynamics of the Congo River plume have until recently been minimally documented. In Hopkins et al. 2013, the authors analysed remotely sensed sea surface temperature, sea level anomaly, salinity from SMOS and chlorophyll concentration from 2010 to describe and quantify the extent, strength and seasonality of the plume and to explain its behaviour in relation to winds, ocean currents and freshwater discharge. Empirical Orthogonal Function (EOF) analysis reveals strong seasonal and coastal upwelling signals, potential bimodal seasonality and responses to fresh water discharge peaks in all data sets. Salinity and chlorophyll are significantly negatively correlated (−0.4 to −0.9) across a 500 km2 zone west of the river mouth. Lagged correlations with river discharge show the westward translation, dispersal and strengthening of a similar sized region of positive chlorophyll-discharge and negative salinity-discharge correlations. Peaks in chlorophyll lag the discharge by 1–4 months, although it is not possible from ocean colour alone to distinguish increases in chlorophyll resulting from the dispersal of nutrient rich river discharge from other physical and biological mechanisms that promote changes in surface chlorophyll, or indeed have confidence that the signal has not been contaminated by other optically active substances. The strongest plume-like signatures from EOF analysis are found in the salinity and colour data sets,which are then also analysed using a statistically based water mass detection technique to isolate the behaviour of the plume. The validity of the technique is checked against ARGO profiles. Throughout the year the main axis of the freshwater plume extends between 400 and 1000 km, northwest along the coastline, or west–southwest out into the open south Atlantic. Changes in the magnitude and direction of wind stress and hence wind driven surface currents are the principal driving force behind this far-field variability, although the strength and direction of the Angola and Benguela Coastal currents may also play a role. The mean surface salinity within the plume and its surface area have qualitative links to the seasonal cycle in river discharge and wind stress.
Conservative mixing laws for bio-optical properties of the major river plume in the ETA region can now be systematically studied using SMOS data as shown in Reul et al. 2014. Examples of the conservative mixing linear laws for the CDOM coefficient deduced only from space-borne measurements were shown for year 2010 around the Congo and Niger rivers.
SSS seasonal and interannual variability in response to the Congo river discharge
SSS variability associated with the Congo River discharge was examined in Chao et al. 2015, using Aquarius satellite retrieved SSS data and vertical profiles of salinity measured by the Argo floats. The Congo River and its adjacent coastal ocean region are selected for study because of their global importance in ocean-fresh water dynamics undermined by the lack of observational data and coordinated efforts to make in situ measurements in this region.With a weekly repeat orbit, Aquarius provides a unique opportunity to routinely map the SSS in this relatively remote and understudied region.The Congo River plume can be clearly identified in the Aquarius SSS data with a northwestward extension of 500–1000 km off the coast of the Democratic Republic of Congo (DRC).The peak amplitude of the SSS variability associated with the Congo River discharge exceeds 3.0psu,significantly greater than the designed AquariusSSS retrieval accuracy of 0.2 psu. Using the first two years of Aquarius data from September 2011 to August 2013, a well-defined seasonal cycle is described: maximum freshwater anomalies are found in the boreal winter and spring seasons.The anomalies during the 2012–2013 winter and spring seasons are significantly fresher than the 2011–2012 winter and spring seasons, suggesting a strong year-to-year variability. A strong correlation is found between month-to-month variations in upper ocean salinity (as revealed by Aquarius satellite and Argo observations) and month-to-month variations in the freshwater discharge from the Congo River over a region off the coast of West Africa that is large enough to be easily observed by the Aquarius satellite.Vertical profiles of salinity derived from Argo floats reveal that these freshwater anomalies can be traced to 30m below the sea surface. Combining the spatial area characterized by strong negative correlations between Aquarius SSS data and Congo discharge with the Argo vertical profiles of salinity, the volume of the freshwater anomalies is inferred and used to estimate the Congo River discharge. Reasonably good agreement is found between the Congo River discharge as observed by a stream gauge at Brazzaville and that estimated from the combined Aquarius and Argo data, especially during the freshening portion of the seasonal cycle (during this phase the correlation is 0.84, implying~70% of the variance can be explained).The precipitation minus evaporation portion of the freshwater flux is found to play a secondary role in this region.
Taking advantage of the spatially dense, multi-year time series of global Sea Surface Salinity (SSS) from SMOS and Aquarius concurrent satellite missions, the spatial and temporal decorrelation scales of SSS in the Tropical Atlantic 30°N–30°S were quantified in Tzortzi et al. (2016) for the first time from Space observations. Given the dominance of the seasonal cycle in SSS variability in the region, the length scales are calculated both for the mean and anomaly (i.e. seasonal cycle removed) SSS fields. Different 7–10 days composite SSS products from the two missions are examined to explore the possible effects of varying resolution, bias corrections and averaging characteristics. With the seasonal cycle retained, the SSS field is characterized by strongly anisotropic spatial variability. Homogeneous SSS variations in the Tropics have the longest zonal scales of over ~ 2000 km and long temporal scales of up to ~ 70–80 days, as shown by both SMOS and Aquarius. The longest meridional scales, reaching over ~ 1000 km, are seen in the South Atlantic between ~ 10°–25°S, most discernible in Aquarius data. The longest temporal scales of SSS variability are reported by both satellites to occur in the North-West Atlantic region 15°–30°N, at the Southern end of the Sargasso Sea, with SSS persisting for up to 150–200 days. The removal of the seasonal cycle results in a noticeable decrease in the spatio-temporal decorrelation scales over most of the basin. Overall, with the exception of the differences in the South Atlantic, there is general agreement between the spatial and temporal scales of SSS from the two satellites and different products, despite differences in individual product calibration and resolution characteristics. These new estimates of spatio-temporal decorrelation scales of SSS improve our knowledge of the processes and mechanisms controlling the Tropical Atlantic SSS variability, and provide valuable information for a wide range of oceanographic and modelling applications.
SSS in the Congo region and the Cold Tongue
The physical processes implied in the SSS increase in the equatorial Atlantic Cold Tongue (ACT) region during boreal spring and the lag observed between boreal spring SSS maximum and sea surface temperature (SST) summer minimum were examined by Da-Allada et al., (2016) using mixed‐layer salinity budgets computed from observations (SMOS) and model during the period 2010–2012. The boreal spring SSS maximum is mainly explained by an upward flux of high salinity originating from the core of the Equatorial Undercurrent (EUC) through vertical mixing and advection. The vertical mixing contribution to the mixed‐layer salt budget peaks in April–May. It is controlled primarily by (i) an increased zonal shear between the surface South Equatorial Current and the subsurface EUC and (ii) the presence of a strong salinity stratification at the mixed‐layer base from December to May. This haline stratification that is due to both high precipitations below the Inter Tropical Convergence Zone and zonal advection of low‐salinity water from the Gulf of Guinea explains largely the seasonal cycle of the vertical advection contribution to the mixed‐layer salt budget. In the ACT region, the SST reaches its maximum in March/April and minimum in July/August. This SST minimum appears 1 month after the maximum of SSS. The 1 month lag observed between the maximum of SSS in June and the minimum of SST in July is explained by the shallowing of the EUC salinity core in June, then the weakening/erosion of the EUC in June–July which dramatically reduces the lateral subsurface supply of high‐saline waters.